top of page
The 1950s
"The only thing new in the world is the history you don't know" - Harry S. Truman
* * * * * * * * * * * * * * * * * * * * * * * * * * * * * * * * * * * * * * * *
Graphs about the 1950s.

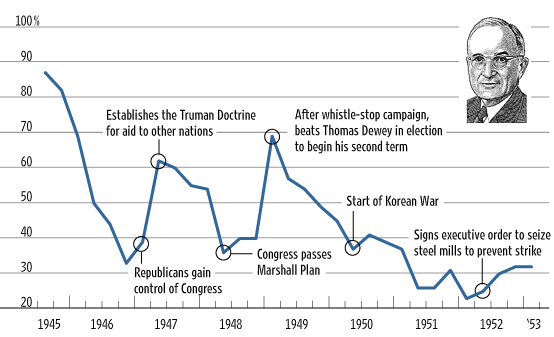


This graphs data shows President Truman's Approval Ratings from 1945 to 1953, his two terms of being the President of the United States.
This is another graph showing the data of birth rates from the year 1940 to 1994. It shows that between the years of 1948 and 1964 that birth rates were at an all time high for the United States.
This graph shows data of birth rates from the years 1900 or 2008. In the 1950s the United States had a huge increase in births after World War II and started the growth of suburbs in the U.S.
This graph show the data of President Eisenhower's approval ratings from his first term of being President of the United States.
bottom of page